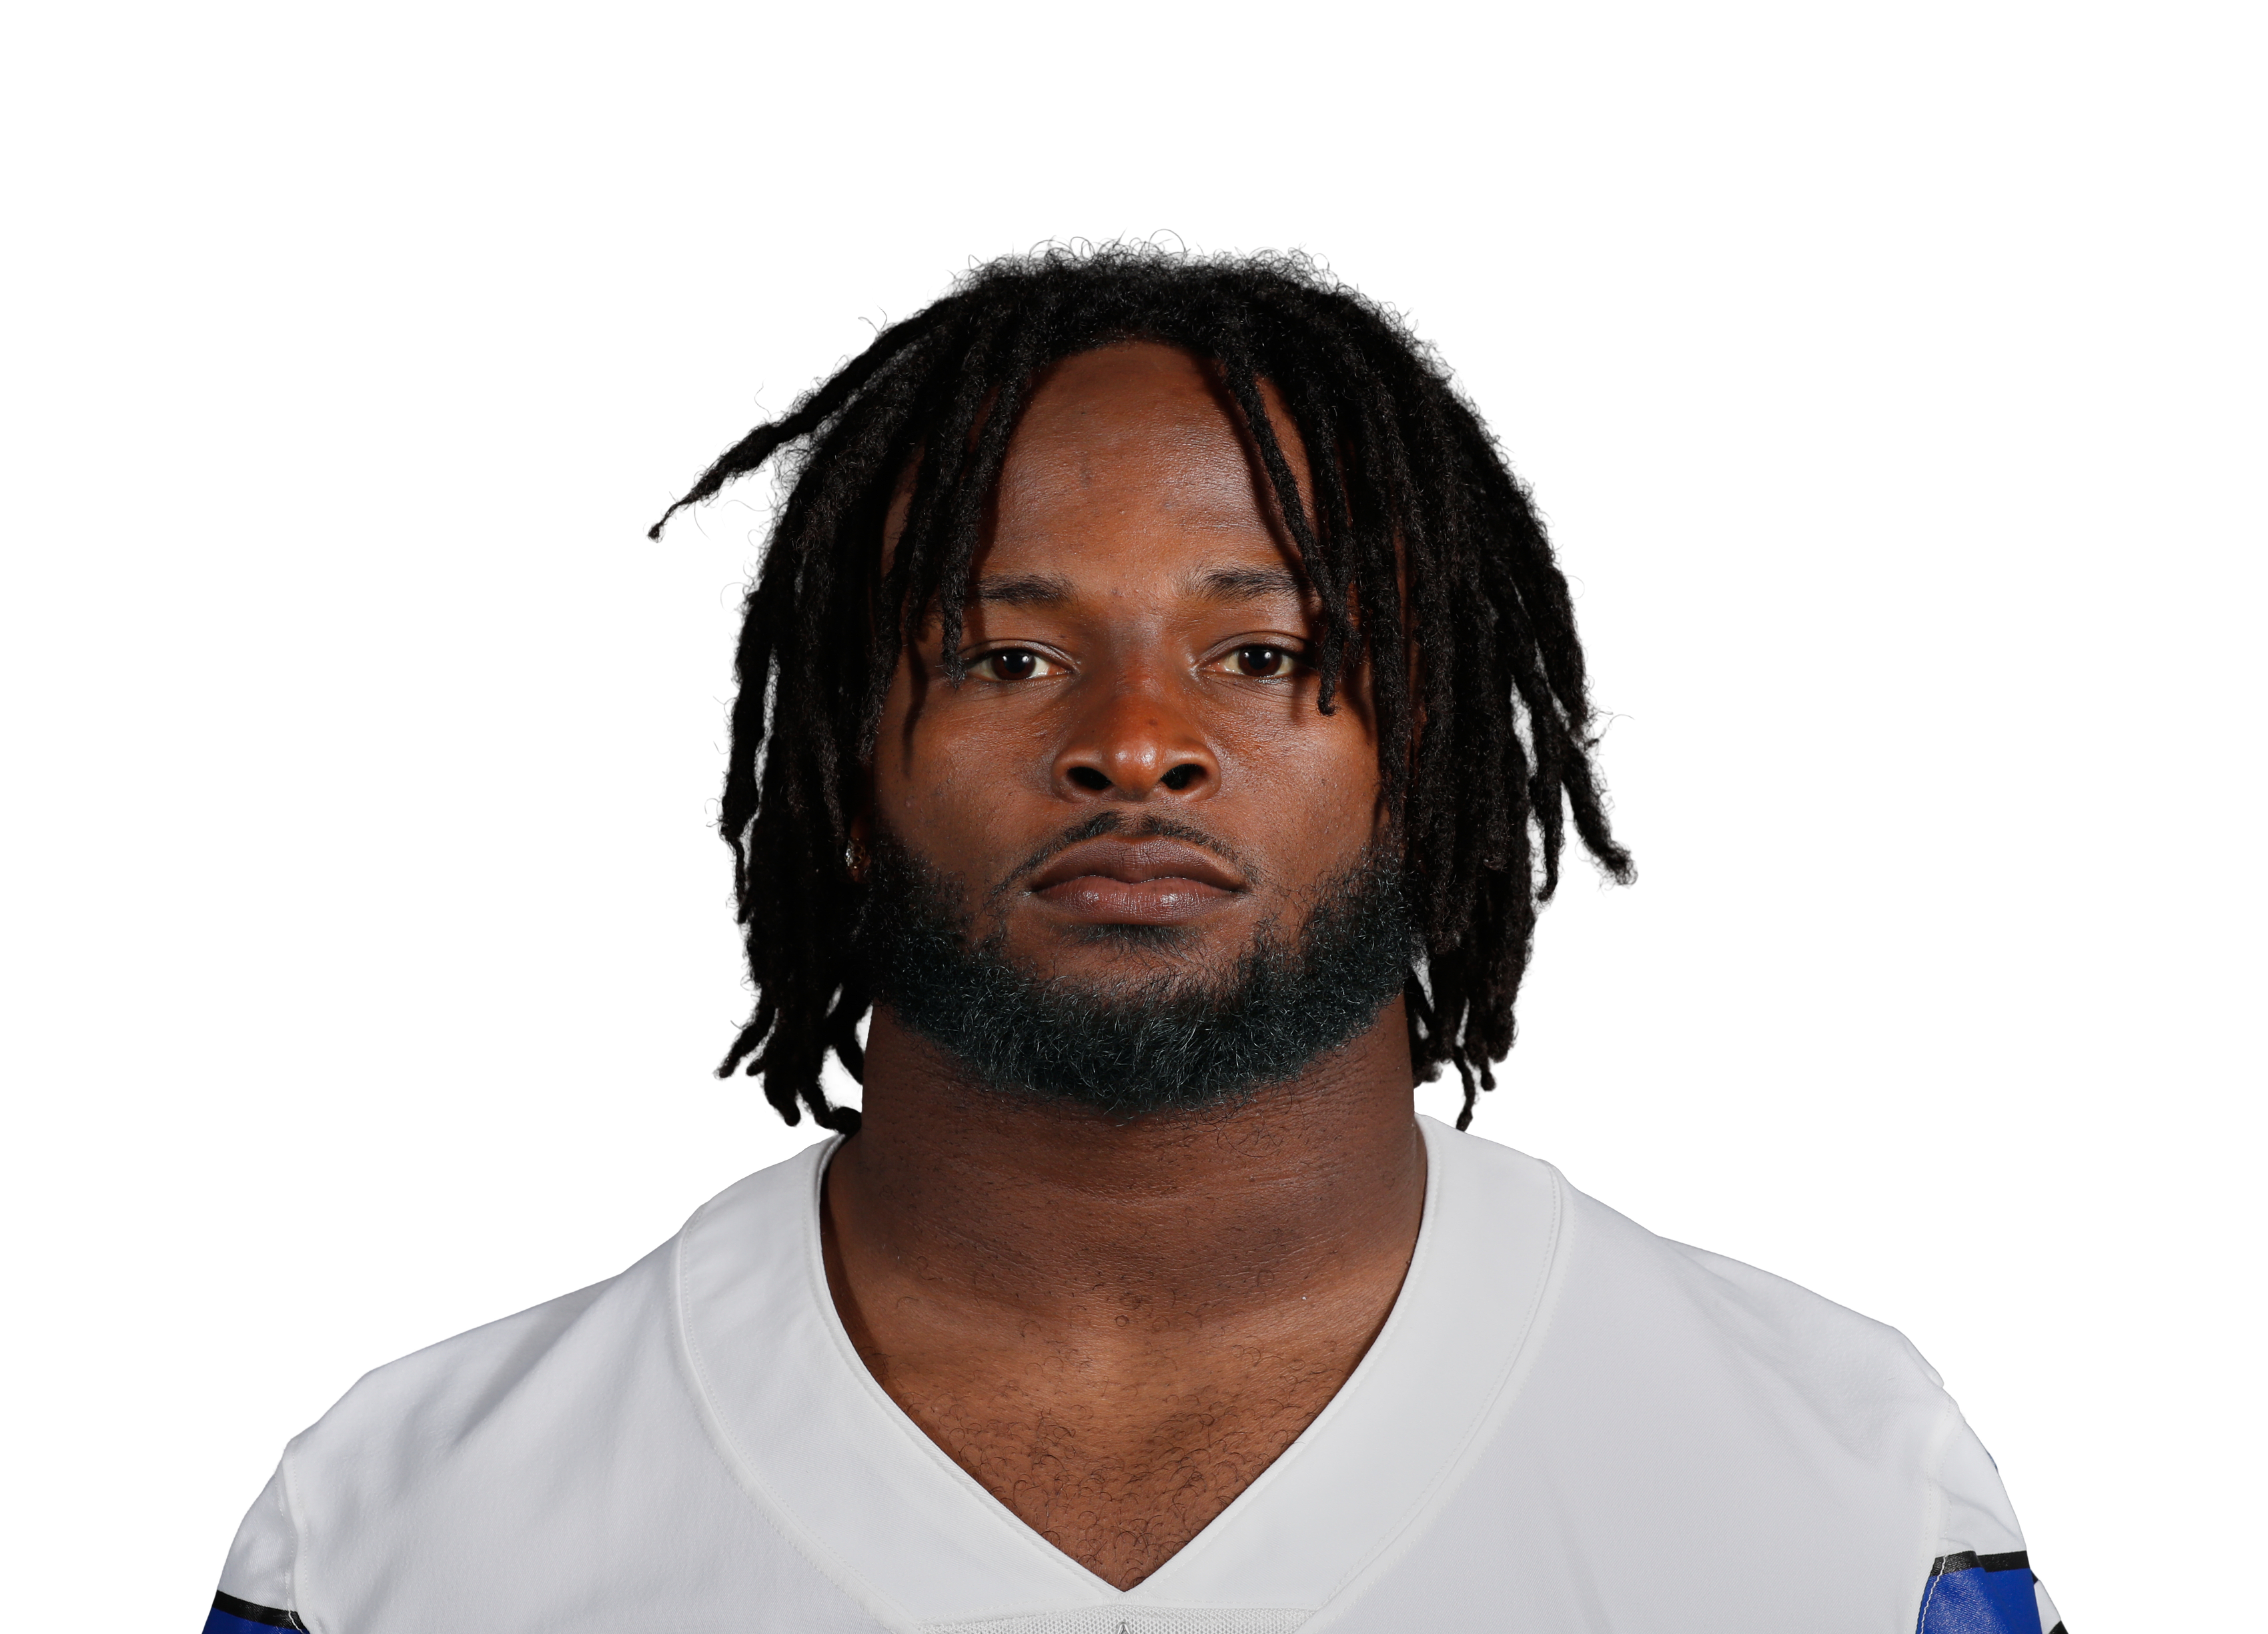
Javonte Williams
RB · DAL
· ESPN
· Pro Football Reference
Box score by season
| Season | Team | G | Rush | Rush yds | TD | Tgt | Rec | Rec yds | TD | vs ESPN |
|---|---|---|---|---|---|---|---|---|---|---|
| 2026 | DAL | 8 | 134 | 528 | 8 | 24 | 20 | 104 | 1 | 1 differ (Targets 24 vs 25) |
| 2025 | DAL | 16 | 252 | 1,201 | 11 | 51 | 35 | 137 | 2 | ✓ matches |
| 2024 | DEN | 17 | 139 | 513 | 4 | 70 | 52 | 346 | 0 | not checked |
| 2024 playoffs | DEN | 1 | 7 | 29 | 0 | 2 | 2 | 14 | 0 | |
| 2023 | DEN | 16 | 217 | 774 | 3 | 58 | 47 | 228 | 2 | not checked |
| 2022 | DEN | 4 | 47 | 204 | 0 | 22 | 16 | 76 | 0 | not checked |
| 2021 | DEN | 17 | 203 | 903 | 4 | 53 | 43 | 316 | 3 | not checked |
Official scoring from play-by-play. Regular-season totals for 2025, 2026 are compared with ESPN's after every rebuild (all players); earlier seasons aren't checked.
Advanced
Designed runs
134
qualifying bar 56
EPA/play
+0.014
10th of 38 · lg -0.077
Success rate
44.8%
9th of 38 · lg 40.5%
Yards/play
3.94
24th of 38 · lg 4.11
Explosive rate
6.7%
30th of 38 · lg 9.3%
Turnover rate
0.0%
1st of 38 · lg 0.6%
TD rate
6.0%
3rd of 38 · lg 3.7%
Every split
EPA per designed run by situation, next to the league. Rank is among qualified players with 20+ designed runs there (1 = best). "Repeats" is the year-to-year correlation for that split (2016–25); near zero means it predicts little. Click a situation to filter to it.
| Situation | Designed runs | EPA/play | Success | Yds/play | League EPA | Rank | Repeats |
|---|---|---|---|---|---|---|---|
| Home / away Setting compare everyone → | |||||||
| Home | 48 | -0.281 | 33% | 2.7 | -0.093 | 34/37 | 0.01 |
| Away | 67 | +0.242 | 54% | 4.5 | -0.059 | 2/35 | -0.00 |
| Neutral site | 19 | -0.047 | 42% | 5.2 | -0.083 | — | — |
| Rest days Setting compare everyone → | |||||||
| Short week (≤5 days) | 12 | -0.007 | 33% | 3.8 | -0.032 | — | 0.32 |
| Normal (6–8 days) | 99 | -0.019 | 42% | 4.1 | -0.094 | 13/38 | -0.14 |
| Extra rest (9–12 days) | 11 | +0.217 | 64% | 3.7 | -0.017 | — | -0.03 |
| Off a bye (13+ days) | 0 | — | — | — | -0.077 | — | — |
| Indoors / outdoors Weather compare everyone → | |||||||
| Indoors | 67 | -0.159 | 37% | 2.9 | -0.108 | 14/22 | 0.00 |
| Outdoors | 67 | +0.186 | 52% | 5.0 | -0.064 | 1/35 | 0.00 |
| Temperature (outdoors) Weather compare everyone → | |||||||
| 60–79°F | 19 | -0.047 | 42% | 5.2 | -0.062 | — | 0.02 |
| 80°F+ | 12 | +0.116 | 58% | 3.4 | -0.039 | — | -0.32 |
| Wind (outdoors) Weather compare everyone → | |||||||
| 0–9 mph | 31 | +0.016 | 48% | 4.5 | -0.070 | 8/25 | 0.07 |
| 10–14 mph | 0 | — | — | — | -0.012 | — | 0.12 |
| Rain or snow (outdoors) Weather compare everyone → | |||||||
| Dry | 67 | +0.186 | 52% | 5.0 | -0.053 | 1/33 | — |
| Rain or snow | 0 | — | — | — | -0.152 | — | — |
| Score Game state compare everyone → | |||||||
| Trailing 9+ | 21 | +0.341 | 76% | 4.4 | -0.047 | 2/5 | 0.01 |
| Trailing 1–8 | 40 | +0.029 | 40% | 3.9 | -0.081 | 9/23 | 0.02 |
| Tied | 31 | -0.091 | 42% | 4.2 | -0.096 | 11/23 | 0.10 |
| Leading 1–8 | 21 | -0.069 | 43% | 4.1 | -0.086 | 11/21 | 0.00 |
| Leading 9+ | 21 | -0.107 | 29% | 3.0 | -0.054 | 12/14 | -0.13 |
| Win probability Game state compare everyone → | |||||||
| Win prob under 20% | 15 | +0.441 | 80% | 5.0 | -0.040 | — | 0.13 |
| Win prob 20–80% | 84 | -0.031 | 42% | 3.8 | -0.081 | 15/38 | -0.05 |
| Win prob over 80% | 35 | -0.062 | 37% | 3.7 | -0.081 | 14/25 | -0.09 |
| Quarter Game state compare everyone → | |||||||
| Q1 | 38 | -0.017 | 50% | 4.3 | -0.072 | 12/28 | 0.09 |
| Q2 | 28 | +0.016 | 43% | 3.9 | -0.080 | 10/25 | -0.04 |
| Q3 | 36 | +0.037 | 50% | 3.8 | -0.058 | 8/30 | 0.12 |
| Q4 | 31 | +0.035 | 35% | 3.7 | -0.093 | 9/25 | -0.02 |
| OT | 1 | -0.388 | 0% | 2.0 | -0.139 | — | — |
| Two-minute Game state compare everyone → | |||||||
| Last 2 min of half | 8 | +0.162 | 62% | 5.1 | -0.100 | — | — |
| Rest of game | 126 | +0.004 | 44% | 3.9 | -0.075 | 10/38 | — |
| Down Situation compare everyone → | |||||||
| 1st down | 77 | -0.063 | 40% | 3.6 | -0.082 | 19/38 | 0.02 |
| 2nd down | 40 | +0.160 | 48% | 5.0 | -0.102 | 5/34 | -0.03 |
| 3rd down | 14 | +0.395 | 64% | 3.6 | +0.007 | — | -0.14 |
| 4th down | 3 | -1.733 | 33% | 0.3 | +0.032 | — | — |
| 3rd-down distance Situation compare everyone → | |||||||
| 3rd & 1–3 | 8 | +0.372 | 75% | 2.4 | +0.033 | — | — |
| 3rd & 4–6 | 0 | — | — | — | -0.052 | — | — |
| 3rd & 7+ | 6 | +0.425 | 50% | 5.2 | -0.060 | — | — |
| Field position Situation compare everyone → | |||||||
| Own 20 and in | 8 | +0.083 | 50% | 4.2 | -0.136 | — | 0.05 |
| Own 50–21 | 56 | -0.142 | 41% | 4.9 | -0.090 | 19/35 | -0.01 |
| Opp 21–49 | 34 | +0.153 | 47% | 4.4 | -0.067 | 5/34 | 0.07 |
| Red zone (opp 20 in) | 36 | +0.109 | 47% | 2.0 | -0.033 | 5/14 | 0.06 |
| Formation Style compare everyone → | |||||||
| Shotgun | 43 | -0.037 | 47% | 3.5 | -0.093 | 12/31 | 0.03 |
| Under center | 91 | +0.038 | 44% | 4.2 | -0.068 | 10/38 | 0.03 |
| Tempo Style compare everyone → | |||||||
| Huddle | 126 | +0.014 | 45% | 3.9 | -0.083 | 8/38 | 0.03 |
| No huddle | 8 | +0.004 | 38% | 5.2 | +0.081 | — | 0.03 |
| Yards to go Situation compare everyone → | |||||||
| 1–3 to go | 37 | +0.046 | 57% | 2.8 | +0.023 | 9/16 | 0.12 |
| 4–6 to go | 16 | +0.102 | 44% | 4.5 | -0.046 | — | -0.02 |
| 7–10 to go | 78 | -0.051 | 38% | 4.3 | -0.110 | 12/38 | -0.06 |
| 11+ to go | 3 | +0.817 | 67% | 5.7 | -0.167 | — | — |
| Run direction Running compare everyone → | |||||||
| Left | 50 | +0.215 | 50% | 5.4 | -0.041 | 4/36 | 0.04 |
| Middle | 48 | -0.031 | 40% | 3.3 | -0.093 | 6/30 | 0.16 |
| Right | 36 | -0.206 | 44% | 2.9 | -0.066 | 25/31 | 0.11 |
| Run gap Running compare everyone → | |||||||
| Outside (end) | 9 | -0.267 | 33% | 2.7 | +0.001 | — | -0.03 |
| Off tackle | 40 | +0.144 | 55% | 5.2 | -0.046 | 3/21 | -0.00 |
| Inside (guard) | 37 | -0.001 | 43% | 3.8 | -0.103 | 8/29 | 0.11 |
| Up the middle | 48 | -0.031 | 40% | 3.3 | -0.093 | 6/30 | 0.16 |
| Defenders in the box Defense (FTN) compare everyone → | |||||||
| Light box (6 or fewer) | 56 | +0.080 | 50% | 5.2 | -0.083 | 8/37 | 0.13 |
| 7 in the box | 72 | -0.007 | 39% | 3.3 | -0.072 | 12/37 | -0.02 |
| Stacked box (8+) | 6 | -0.360 | 67% | 0.3 | -0.072 | — | 0.34 |
| Pre-snap motion Scheme (FTN) compare everyone → | |||||||
| Motion | 62 | -0.095 | 39% | 3.4 | -0.092 | 22/38 | -0.21 |
| No motion | 72 | +0.107 | 50% | 4.4 | -0.052 | 5/29 | -0.21 |
| RPO Scheme (FTN) compare everyone → | |||||||
| RPO | 12 | +0.027 | 42% | 4.2 | -0.061 | — | — |
| Not an RPO | 122 | +0.012 | 45% | 3.9 | -0.078 | 10/38 | — |
By season
| Season | Team | Designed runs | EPA/play | Total EPA | Success | Yds/play | Explosive | 1st-down rate |
|---|---|---|---|---|---|---|---|---|
| 2026 | DAL | 134 | +0.014 | +1.8 | 44.8% | 3.94 | 6.7% | 26.1% |